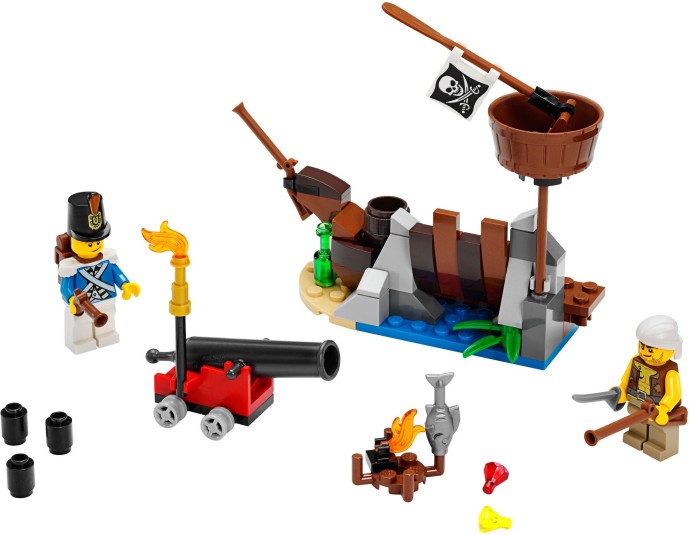

Pirates is a LEGO category that had 84 sets released in 1989, 1991-1997, 2001-2002, 2009, 2013 & 2015. This page details statistics of this theme, derived from all of the reviews Brick Insights has gathered and interpreted. You'll find a breakdown of the following:
Let's get the best part done first. These are the highest rated Pirates sets of all time.
Just for fun - these are the worst rated Pirates sets.
78
is the average rating of all Pirates sets.
This rating is the average of all 76 scored sets in Pirates. Compared to other categories this is average. 8 unscored sets are not included. 90% of all sets in this category are scored. Here's the distribution of all categories and where Pirates is in relation to the others.
To know what it takes for a set to get a score and thus be included in these calculations, check out the FAQ.
Years without scored sets are not included.
Alright, so that's the rating. But are the sets generally recommended? The data we've collected shows that the majority of Pirates sets are considered up to personal taste:
45%
Total: 82 / 84
Not all sets in our database are marked as recommended or not. We currently have 2 sets in Pirates that are considered unknown. They are excluded from these calculations.
A set is considered recommended when the majority of reviews recommend it. If you're interested in knowing when a review is considered a recommendation, I keep that reasoning updated in Brick Insights FAQ. I've also written an article detailing the recommendation distribution of all reviews.
Since part prices vary a lot depending on part types, Brick Insights attempts to group similar categories together. We call these meta-categories comparable categories. Pirates is bundled into System along with these:
The average price per part (PPP) of all System sets is 0.18. The average PPP for Pirates is 0.20. Meanwhile, the average price per minifig (PPM) in System is 19.55 and the average PPM for Pirates is 7.10.
All prices are adjusted for inflation.